Skip to content
 Most jewelry brands that are not converting their ad spend have the same problem. It is not the product or the price. It is four leaks happening at the same time, being treated as separate issues. For the average brand, 10,000 people see the ads. Three hundred click. Seven buy. One comes back. Each number looks fine on its own. A 3% CTR is within normal. Seven sales from 10,000 views is “just how it works.” Together, they are one funnel losing revenue at every stage.
Key Takeaways
- The average jewelry brand converts 10,000 ad views into 7 sales. The problem is not the top of the funnel. It is four leaks across every stage.
- Strong jewelry ad creative delivers 5 to 8% CTR. Industry average is 3%. The difference is double the traffic from the same spend.
- 4 in 10 people who clicked your ad leave the site in under 10 seconds. In most cases, the landing page does not match the ad.
- Cart abandoners are the highest-intent audience in the retargeting pool. Most brands run no ads to bring them back.
- Brands with a post-purchase email sequence run 35% repeat purchase rates. Brands without one average 15%.

DOWNLOAD THE FULL BLUEPRINT
The Jewelry Brand Growth Blueprint covers the full funnel fix in detail. Ad formats by buyer stage, retargeting setup, and post-purchase sequence templates.
Download it free: Jewelry Growth Blueprint
Stage 1: The Ad
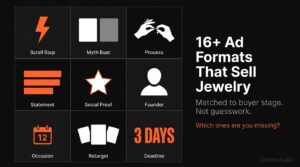
3% CTR is average for jewelry ads. Strong creative delivers 5 to 8%, which is double the traffic from the same spend. The difference shows up in the first two to three seconds. Most jewelry ads lead with the product, which converts buyers already thinking about jewelry and misses everyone else. The creative that breaks 5% consistently leads with an emotion or a specific moment before the product appears. The feeling the piece creates. The occasion it belongs to. The product becomes the payoff, not the opener. Meta’s own Ads Manager benchmarks (Ads Manager benchmarks) show emotional hooks outperforming product-first creative in most consumer verticals.
Fix: Test creative that leads with an emotional hook or a specific occasion before the product appears in frame.

Stage 2: The Website
4 in 10 people who clicked the ad leave before seeing a single product. This is not a website quality problem. It is a mismatch problem. The ad made a specific emotional promise. The landing page broke it. A Valentine’s Day gift ad landing on a homepage showing engagement rings, men’s jewelry, and a newsletter popup loses that buyer before the page finishes loading. Page load speed makes it worse. Google’s research (Google web.dev, mobile page speed impact on conversions) shows a one-second delay costs 7% of conversions on mobile, which is where most jewelry traffic arrives.
Fix: Send each campaign to its own landing page. Match the page to the ad’s promise. Audit mobile load speed.

Stage 3: The Product Page
Of the visitors who stay, only 10% show real buying intent. Almost all of the gap between 10% and 40% lives on the product page. A page that converts shows the piece on a real person, answers sizing through photography, includes reviews with photos, and handles the questions every buyer carries. Is this worth it? Where is it made? What if it does not fit? A page that only shows the piece on white with a price leaves those questions unanswered.
Fix: Add lifestyle photography, photo reviews, a sizing guide, and an FAQ to each product page.

Stage 4: The Purchase
6 in 10 buyers with real purchase intent do not complete the transaction. Baymard Institute (Baymard Institute, cart abandonment data) puts jewelry cart abandonment above the global 70% average. Three things drive most of it. No buy-now-pay-later option (for pieces above $300, Affirm or Klarna win buyers who otherwise abandon at the payment screen). No concrete reason to decide now (without a shipping deadline or limited availability note, “later” becomes the default). And no cart abandonment retargeting. A buyer who added to cart and did not finish is the highest-intent audience in the retargeting pool. They already decided they wanted it.
Fix: Add BNPL options, create a real urgency mechanism, and build cart abandonment retargeting showing the exact product left behind.

Stage 5: The Repeat
1 in 7 buyers comes back. The brands running 35% repeat purchase rates are not doing better advertising. They built a post-purchase sequence. 5 to 7 emails in the 30 days after delivery. Delivery check-in, review ask, complementary product introduction, early access to new work. The customer who just received their order is in the most open state they will be in until they buy again. That window is short. Most brands leave it empty. Klaviyo’s email benchmarks consistently show post-purchase flows driving the highest revenue per recipient of any jewelry brand email program. Every 1% lift in LTV (lifetime value) compounds against every dollar of ad spend. Brands with a 35% repeat rate run a fundamentally different business from brands at 15%.
Fix: Build a post-purchase email sequence starting within 48 hours of delivery.

Where To Look First
CTR under 3%: the creative is the constraint.
Bounce rate above 50%: the landing experience does not match the ad.
Low product page intent: product pages need to do more selling.
High cart abandonment: add payment options and retargeting.
Repeat rate under 20%: build a post-purchase sequence.

Frequently Asked Questions
What’s a good click-through rate for jewelry Facebook ads?
Strong CTR for jewelry ads lands between 5 and 8%. Industry average is around 3%. Getting above 5% consistently requires leading with emotion or a specific occasion before the product appears. The hook stops the scroll. The product becomes the payoff.
How do I reduce bounce rate on my jewelry site?
Send paid traffic to campaign-specific landing pages, not your homepage. The page needs to deliver on the promise the ad made. Add lifestyle images showing pieces on real people with clear size reference. Check mobile load speed with a tool like Google PageSpeed Insights (speed audit tool).
What’s the fastest way to increase repeat purchases?
Build a post-purchase email sequence starting 24 to 48 hours after delivery. Delivery check-in, review request, complementary product introduction, early access to new work. Most brands have not built this, which is exactly why most brands run 15% repeat rates.
Conclusion
The funnel is not broken. It is leaking. And every stage where it leaks is a stage where it can be fixed. A 3% improvement at Stage 2 and a post-purchase sequence at Stage 5 can double the revenue from the same ad spend. No new audience needed. The buyers are already there. They just need the right experience at each stage.
Every jewelry brand has a funnel. Most have not mapped where it is leaking. We will look at your specific traffic, your conversion rates at each stage, and your post-purchase retention. Then tell you exactly where the highest-leverage fix is and what it is worth in revenue.
Get Your Free Personalized Audit → Personalized Audit