 Skip to content
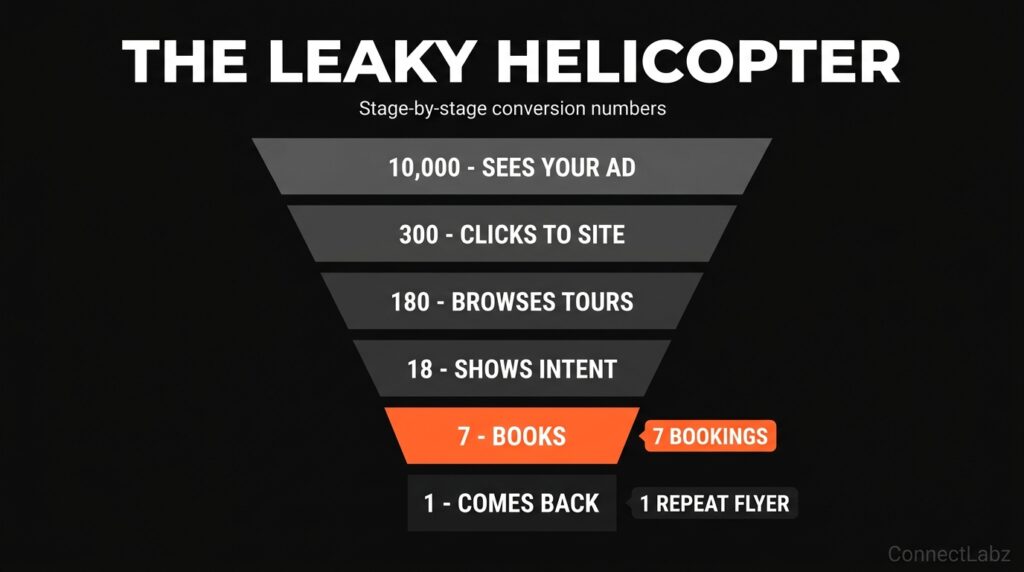
Every helicopter sightseeing operator runs the same customer journey. Most leak revenue at every stage. 10,000 ad views become 300 clicks, 180 browsers, 18 intenders, 7 bookings, and only 1 repeat flyer. Fix any single stage and revenue roughly doubles without a bigger ad budget.
Key Takeaways
- 10,000 views become 7 bookings and 1 repeat flyer. The biggest drops are at browse, intent, and repeat stages.
- Strong aerial hooks lift click-through from 3 to 5 to 8 percent.
- Baymard Institute research shows most travel sites lose 40 percent of traffic to slow loads.
- A post-flight sequence lifts repeat bookings by 35 percent.
- Retargeting recovers buyers who need 3 to 7 visits before committing.
Download the Blueprint
See every stage with real numbers in the Helicopter Sightseeing Growth Blueprint. Download it free.
Top of Funnel: Traffic & Ads
Stage 1: Sees Your Ad
Meta points to the first 2 to 3 seconds deciding the ad. Polished brand shots lose to raw POV footage in almost every test.
Fix: Open every ad with a POV skyline reveal or a real passenger reaction.
Stage 2: Clicks to Site
Strong hooks push click-through to 5 to 8 percent. That doubles traffic at the same spend.
Fix: Test 10 to 20 hook variations a month. Kill anything under 4 percent CTR.
Middle & Bottom of Funnel: Conversion
Stage 3: Browses Tours
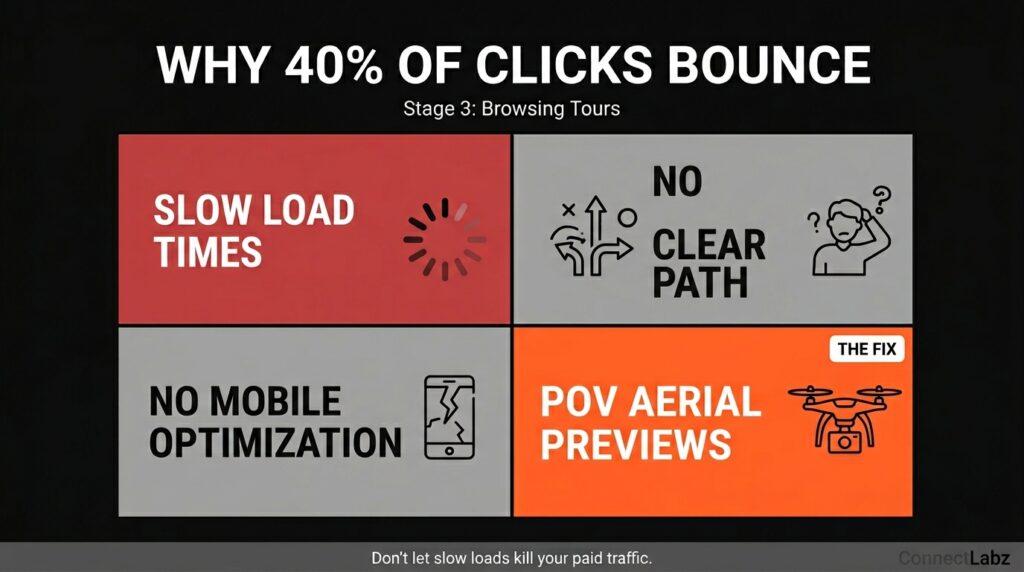
Forty percent bounce. Google’s PageSpeed Insights shows mobile pages slower than 3 seconds lose most of their traffic.
Fix: Optimize Core Web Vitals and put the book button above the fold.
Stage 4: Shows Intent
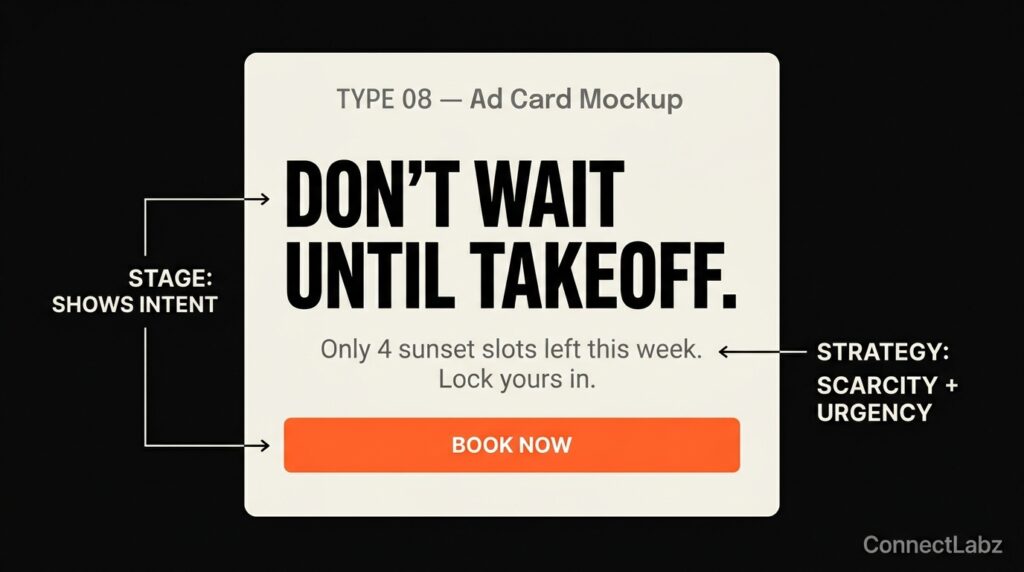
Most operators show tour specs and call that a page. A page that sells has aerial video, reviews, a route map, and a weather guarantee.
Fix: Rebuild each tour page with social proof, aerial video, and a weather answer.
Stage 5: Books
No follow-up, no retargeting, no urgency. Most operators walk away from a cart abandon.
Fix: Email and SMS cart recovery inside 30 minutes. Retarget intent visitors for 30 days.
Stage 6: Comes Back
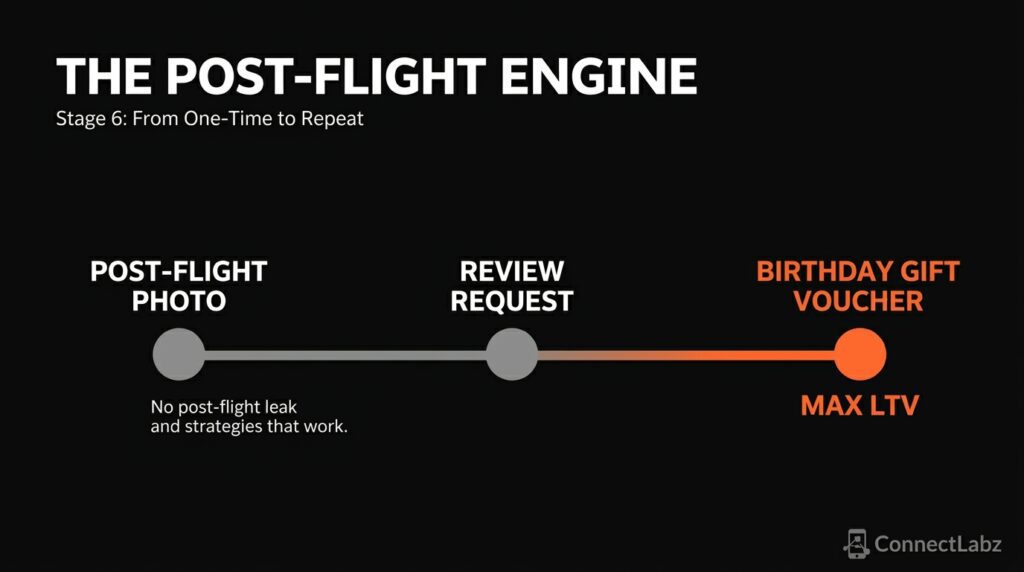
Most operators never hear from a flyer after the flight. That is the end of the LTV.
Fix: Five-step post-flight sequence over 60 days.
See Your Own Funnel Math
The numbers above are industry medians. Yours will be different. Plug your monthly ad spend, click-through rate, average tour value, and bookings into our free marketing KPI calculator. It mirrors the same six-stage math and shows you which stage is leaking the most revenue right now, in dollars, on your own operation.
Frequently Asked Questions
Where do helicopter tour operators lose the most revenue?
The browse to intent step loses 90 percent of traffic. Tour pages that display specs instead of selling the view are the biggest culprit.
What one fix moves bookings the fastest?
A proper cart recovery sequence inside 30 minutes of abandon.
Conclusion
10,000 ad views to 7 bookings is the helicopter tour industry standard, and it is not a traffic problem. It is a leak problem at five specific stages, each of which can be plugged without raising your ad budget by a single dollar. Patch the worst-leaking stage first, then the next. Operators that build this discipline turn the same 10,000 views into 14 or more bookings — and that is the difference between scrambling for next weekend and scaling into next season.
You now have the funnel math. We will measure each stage of your operation against industry medians and show the revenue sitting in your biggest drop.
Get Your Free Personalized Audit

